どうも!効率的な仕事ぶり、充実した機能。 Shinyです!
ということで、今回はRのShinyパッケージの紹介をしたいと思います。
Shinyとは
Shinyではインターラクティブなグラフを作ることができます。
Shinyだと、簡単にインターラクティブなグラフを作ることができることは知っていたのですが、思った以上に簡単に書けちゃったので、ご紹介したいと思います。
環境公式
※公式見たのですが、特に断言はされていなかったので、私の環境を載せておきます。
- macOS Mojave 10.14.6
- R 3.5.3
- RStudio 1.1.456
- Shiny 1.1.0
体験手順
とりあえず、RのインストールとRStudioのインストールをしてしまいましょう!(布教)
brew install r
brew cask install rstudio
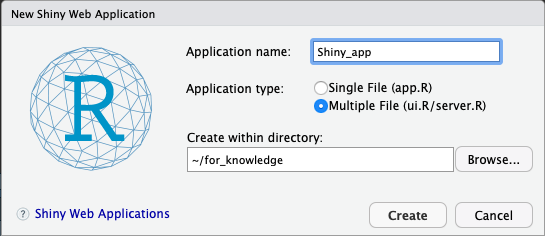
Rstudioを起動したら、左上の白紙に+マークがついているところをクリックし「Shiny Web App…」を選びましょう。(もしかしたらShinyパッケージのインストールが必要かもです。)

Application nameを埋め、「Create」ボタンを押しましょう。
「Run App」ボタンを押しましょう。 するとアプリが起動します。
約60行ほどのコードになります。 ui.R
#
# This is the user-interface definition of a Shiny web application. You can
# run the application by clicking 'Run App' above.
#
# Find out more about building applications with Shiny here:
#
#    http://shiny.rstudio.com/
#

library(shiny)

# Define UI for application that draws a histogram
shinyUI(fluidPage(

  # Application title
  titlePanel("Old Faithful Geyser Data"),

  # Sidebar with a slider input for number of bins
  sidebarLayout(
    sidebarPanel(
       sliderInput("bins",
                   "Number of bins:",
                   min = 1,
                   max = 50,
                   value = 30)
    ),

    # Show a plot of the generated distribution
    mainPanel(
       plotOutput("distPlot")
    )
  )
))
server.R
#
# This is the server logic of a Shiny web application. You can run the
# application by clicking 'Run App' above.
#
# Find out more about building applications with Shiny here:
#
#    http://shiny.rstudio.com/
#

library(shiny)

# Define server logic required to draw a histogram
shinyServer(function(input, output) {

  output$distPlot <- renderPlot({

    # generate bins based on input$bins from ui.R
    x    <- faithful[, 2]
    bins <- seq(min(x), max(x), length.out = input$bins + 1)

    # draw the histogram with the specified number of bins
    hist(x, breaks = bins, col = 'darkgray', border = 'white')

  })

})
60行ほどでこんなものができるってちょっと感動じゃないですか?
ちなみに公式では以下のサンプルが用意されています。
runExample("01_hello")
runExample("02_text")
runExample("03_reactivity")
runExample("04_mpg")
runExample("05_sliders")
runExample("06_tabsets")
runExample("07_widgets")
runExample("08_html")
runExample("09_upload")
runExample("10_download")
runExample("11_timer")
出典:https://shiny.rstudio.com/tutorial/written-tutorial/lesson1
良ければ遊んでみてください。
ちなみに、第81回のR勉強会@東京はShiny特集回でした。 connpassに載っている資料を見ると、Shinyでどんなことができるかが知れると思います。
福治菜摘美
新米エンジニアです。